Monday, August 17, 2026
Recruiting Metrics That Matter: What to Track and Why

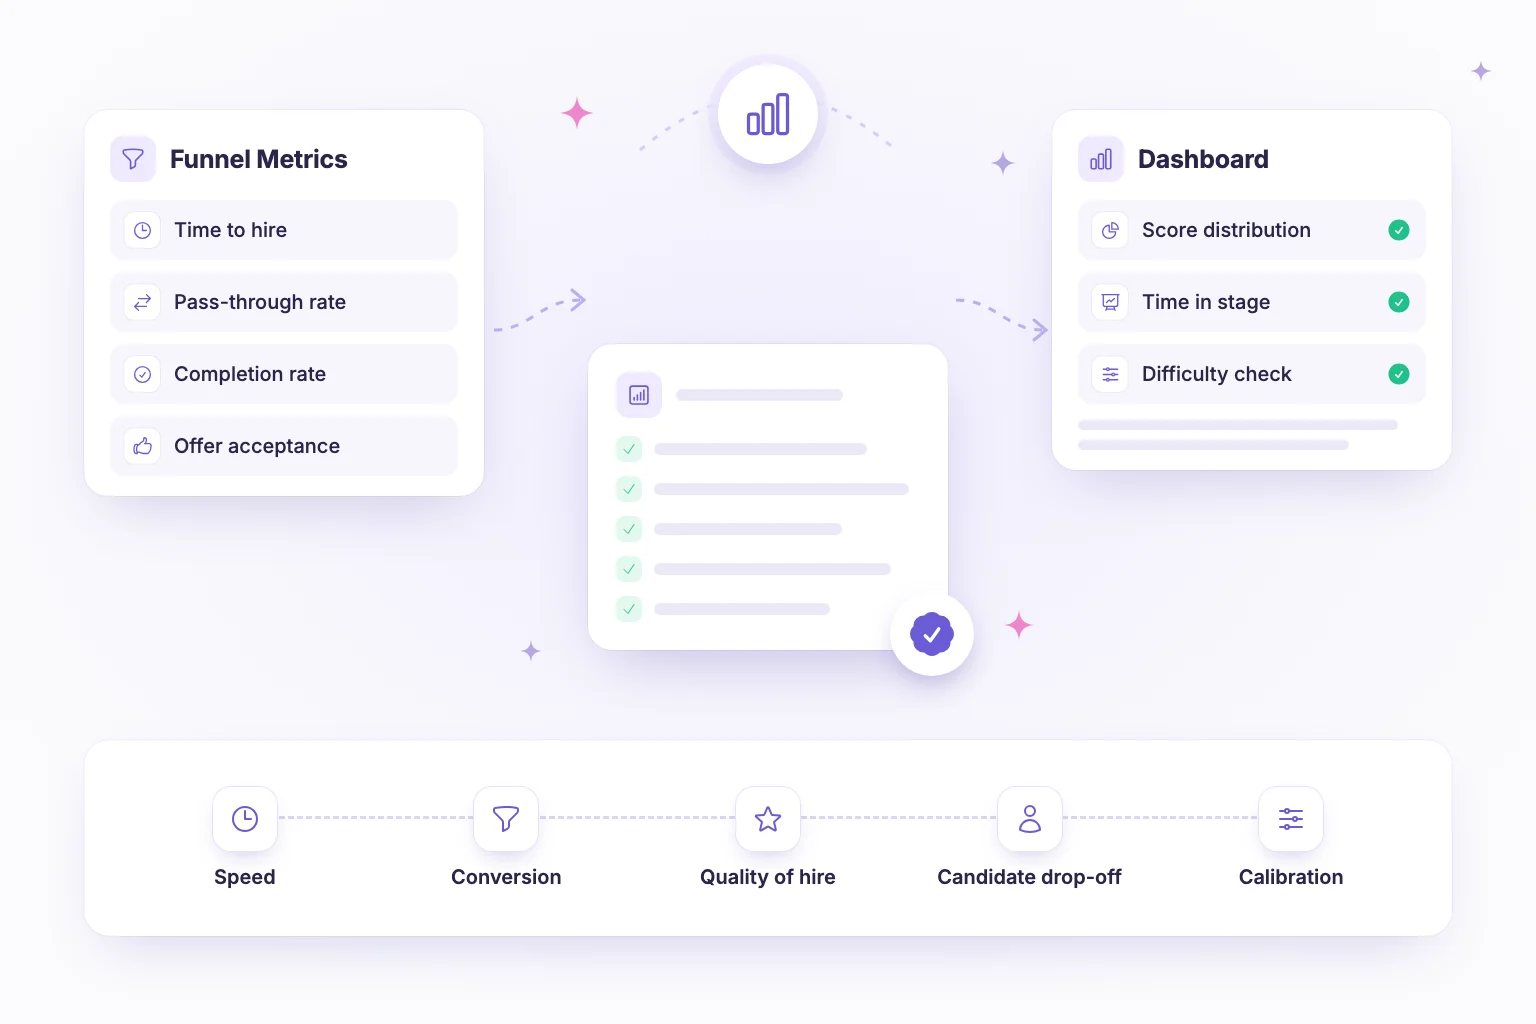
The recruiting metrics that matter most are the ones that tell you whether your hiring process is fast, fair and producing good hires: time to hire, time in stage, pass-through rates, offer acceptance, assessment completion, candidate drop-off and a proxy for quality of hire. Track a small set consistently, calculate each one the same way every time, and use them to find bottlenecks rather than to judge individual recruiters.
Most teams do not suffer from a lack of data. They suffer from dashboards full of numbers nobody acts on. This guide covers the handful of metrics worth tracking, how to calculate each one, what healthy looks like, and the traps that make metrics misleading.
Why most recruiting metrics fail
Recruiting metrics usually fail for one of three reasons. First, they are defined loosely, so “time to hire” means one thing to the recruiter and another to finance. Second, they are reported as averages that hide the real story. Third, they measure activity (emails sent, profiles viewed) instead of outcomes (qualified candidates advanced, offers accepted).
A useful metric answers a question you actually have. “Where are we losing good candidates?” is answered by pass-through rates and drop-off. “Why does engineering take so long to hire?” is answered by time in stage. “Is our assessment predicting anything?” is answered by linking scores to quality of hire. Start from the question, then pick the metric.
The core recruiting metrics and how to calculate them
These are the metrics worth standardising across every role. Agree on the definitions once, document them, and do not change them mid-quarter.
| Metric | Formula | What it tells you |
|---|---|---|
| Time to hire | Offer accepted date − date candidate entered pipeline | How quickly you move a candidate from first contact to yes |
| Time to fill | Offer accepted date − requisition opened date | How long a seat stays empty, including sourcing time |
| Time in stage | Date candidate left stage − date candidate entered stage | Which stage is the bottleneck |
| Pass-through rate | Candidates advancing from stage ÷ candidates entering stage × 100 | How selective each stage is, and whether it filters correctly |
| Offer acceptance rate | Offers accepted ÷ offers extended × 100 | Competitiveness of offers and quality of the late-stage experience |
| Assessment completion rate | Assessments completed ÷ assessments started (or invited) × 100 | Whether your assessment is reasonable in length and clarity |
| Candidate drop-off rate | Candidates who withdraw or go silent at a stage ÷ candidates entering that stage × 100 | Where the process loses people voluntarily |
| Quality of hire (proxy) | Average of agreed indicators, e.g. 90-day manager rating, 12-month retention, ramp time | Whether the process produces people who succeed |
Two notes on calculation. Report time-based metrics as medians, not averages, because one hire that took four months will drag the mean far away from the typical experience. And for completion rate, be explicit about the denominator: completed divided by invited measures interest and invite quality, while completed divided by started measures the assessment itself.
Speed metrics: time to hire and time in stage
Time to hire
Time to hire is the headline speed metric, and the one leadership will ask about. It matters because strong candidates are usually in several processes at once. A slow process does not just delay the hire; it changes who you end up hiring, because the best people accept elsewhere first.
Healthy looks like a time to hire that is stable, predictable per role family and roughly in line with how long your top candidates stay on the market. If you want practical ways to shorten it, see our guide on how to reduce time to hire without lowering the bar.
Time in stage
Time to hire tells you that you are slow. Time in stage tells you where. Break the process into stages (application review, assessment, first interview, onsite or panel, offer) and measure how long candidates sit in each one.
The usual culprits are not the stages themselves but the gaps between them: resumes waiting for review, completed assessments waiting for evaluation, and interviews waiting for a calendar slot. Separating “time to attempt” (invite to start), “time to complete” and “time to evaluate” for assessments makes it obvious whether the delay is on the candidate side or yours.
Funnel metrics: pass-through rates and drop-off
Pass-through rates show how many candidates survive each stage. They are the best tool for checking whether each stage is doing its job.
- A stage that passes almost everyone is probably not filtering. It costs time without adding signal.
- A stage that passes almost nobody may be too hard, poorly calibrated, or sitting after a weak earlier filter that lets unqualified candidates through.
- A sudden change in a pass-through rate usually points to a change upstream, such as a new sourcing channel or a rewritten job description.
Drop-off is different from rejection. It measures candidates who leave voluntarily. High drop-off at the assessment stage often means the test is too long, the invite arrived with no context, or the experience is frustrating. High drop-off after interviews often means slow feedback or a poor interview experience. Our article on improving candidate experience in technical assessments covers the fixes in detail.
Outcome metrics: offer acceptance and quality of hire
Offer acceptance rate
A low offer acceptance rate is expensive because it wastes the entire process that came before it. When it drops, look at three things: compensation relative to the market, how long candidates waited between final interview and offer, and whether the role was described accurately at the start. Candidates who feel the job changed during the process rarely accept.
Quality of hire
Quality of hire is the metric everyone wants and nobody can measure perfectly. Use a combination of proxies agreed with hiring managers:
- Hiring manager satisfaction at 90 days, on a simple structured scale
- Performance rating at six or twelve months
- Retention at twelve months
- Time to productivity or ramp-up
The real value comes from linking these outcomes back to the hiring data. If candidates who scored highly on your coding section consistently receive strong 90-day ratings, the section is predictive. If there is no relationship, it may be measuring the wrong thing. This is also why consistent, structured interview scorecards matter: you cannot correlate outcomes with interview ratings that were never recorded in a comparable way.
Assessment metrics most teams ignore
If you use skills assessments, a few extra metrics tell you whether the assessment itself is healthy:
- Completion rate by role and by section, to spot sections where candidates give up.
- Score distributions. If nearly everyone scores above 90%, the test does not separate candidates. If nearly everyone scores below 30%, it is too hard or misaligned with the role.
- Section-level breakdowns, to see which skills are genuinely scarce in your pipeline.
- Difficulty calibration. Questions that everyone gets right or everyone gets wrong add length without adding signal.
- Integrity insights, such as the share of attempts with proctoring flags, reviewed by a human before any decision.
Common pitfalls with recruiting metrics
- Optimising one metric at the expense of another. Cutting time to hire by skipping assessment usually shows up later as poor quality of hire.
- Comparing unlike roles. A senior engineering hire and a high-volume support hire should not share a target.
- Small sample sizes. Three hires is an anecdote, not a trend. Wait for enough data before redesigning a stage.
- Using metrics to blame people. If recruiters are judged purely on speed, they will move candidates quickly whether or not they are qualified.
- Changing definitions. If “start date” for time to hire shifts between quarters, trends become meaningless.
- Tracking too much. Five metrics reviewed every month beat thirty that nobody reads.
A simple rhythm works for most teams: review speed and funnel metrics monthly, outcome metrics quarterly, and change only one part of the process at a time so you can see what worked.
How NirnAI helps with recruiting metrics
NirnAI captures the data behind these metrics as candidates move through the process, so you are not stitching spreadsheets together at the end of each month. The built-in analytics show assessment completion rates, score distributions and section-level breakdowns, so you can see which skills are scarce and where candidates give up. Time to attempt, time to complete and time to evaluate are tracked separately, which makes it clear whether a delay sits with candidates or with your reviewers.
The pipeline funnel view shows pass-through between stages, and difficulty calibration highlights questions that are too easy or too hard to be useful. Integrity insights summarise proctoring flags, which a human reviewer always decides on. Because visual hiring workflows move candidates through defined stages on a real-time Kanban pipeline, time in stage is measured consistently rather than reconstructed from memory, and structured scorecards give you comparable ratings to link against quality of hire later.
If you want metrics that come straight from the process instead of a monthly clean-up exercise, start a 14-day free trial of NirnAI and see your own funnel within the first week.
Frequently asked questions
- What are the most important recruiting metrics to track?
- Start with a small set: time to hire, time in stage, stage-to-stage pass-through rates, offer acceptance rate, assessment completion rate and a quality of hire proxy such as manager satisfaction or early retention. Together they show speed, funnel health, candidate experience and outcome. Add more only when a specific question needs answering.
- How do you calculate time to hire?
- Time to hire is the number of days between the date a candidate enters your pipeline (applies or is sourced) and the date they accept your offer. Calculate it per hire, then report the median across hires for a role or period. The median is more reliable than the average because a few very slow hires can distort the mean.
- How can you measure quality of hire?
- There is no single perfect measure, so use proxies. Common ones are hiring manager satisfaction at 90 days, performance ratings at six or twelve months, early retention and ramp-up time. Link these back to assessment and interview scores to see which parts of your process actually predict good outcomes, then refine the process accordingly.
- What is a good assessment completion rate?
- It depends on role, seniority and assessment length, so compare against your own baseline rather than a universal number. A falling completion rate usually signals an assessment that is too long, unclear instructions, poor timing of the invite or technical friction. Look at where candidates drop off inside the assessment to find the cause.